La Bodega
Structural Recovery of a Live Retail Launch
Client
LA BODEGA SUPERMARCADO
Industry
Retail
Year
2026
Duration
1 Week
Role
Service Designer
Project overview.
La Bodega opened as a 25,000 sq ft hybrid grocery and restaurant serving a working-class Latino community. It was the only nearby source for culturally specific groceries that could not easily be substituted.
On Day 1, 40% of SKUs failed at checkout
OPERATIONAL SCALE AT LAUNCH
$3K–$5K
Daily transaction volume
$8K–$10K
Weekend transaction volume
~2,500
Active SKUs
With ~40% SKU recognition failure, roughly $1.2K–$2K of daily transactions lacked reliable product attribution.
Price disputes had no resolution path because transactions were not linked to registered products. Revenue was recorded without product attribution, making margin verification impossible.
Structural Failures Identified
SKU recognition failure
~40% products returned “Item Not Found” across terminals
Price mismatch at checkout
Shelf price ≠ POS price
2–5 min checkout time
Product lookup occurred during live transactions.
No product onboarding stage
Products moved from delivery to shelf with no system entry.
No product governance
Products billed as “Miscellaneous.” No SKU-level attribution.
No role ownership
All staff improvised tasks. No accountability structure.
Measured Outcomes — 72 Hours
SKU Recognition Optimized
~100% product recognition restored
Margins measurable and enforceable
Market-aligned pricing per SKU
<30 sec checkout time
Transactions processed without lookup stalls
Product master database established
Mandatory onboarding stage inserted before shelving
Established product governance
All products billed are SKU-attributed
Defined role ownership
Weekly governance cadence established
Root Cause Hypothesis:
Inventory was entering the system only at checkout instead of at receiving.

01
PRE-LAUNCH CRISIS
The store was opening in 24 hours.
The POS didn't recognize the inventory.
During the pre-opening dry run, the checkout system failed to recognize a large portion of products on the floor. Because all registers shared the same product database, the failure wasn't localized — every terminal broke at once, taking down both grocery checkout and restaurant billing simultaneously.
With customers expected the next morning and no time to replace infrastructure, the system had to be stabilized within the existing infrastructure before opening.
Why not delay opening?
Public launch commitments and vendor contracts made postponement financially infeasible.
Why not replace pos?
Vendor configuration and migration required 2–3 weeks — outside the 72-hour window.
02
DECISION PRIORITIZATION FRAMEWORK
Sequenced by operational dependency, not urgency alone.
Each phase unlocked the next. Stabilization kept operations viable long enough to diagnose. Diagnosis made the structural fix precise. The fix was testable because the investigation documented what failed.
IMMEDIATE STABILIZATION
→
Hours 0–10
ROOT CAUSE MAPPING
→
Hours 10–36
STRUCTURAL INFRASTRUCTURE
Hours 36–72
01
CONTAIN FAILURE
Preserve revenue flow. Prevent trust collapse. Create the conditions for diagnosis.
Hours 0–10
SEQUENCING LOGIC
Before fixing the system, the first decision was to prevent collapse. Investigation requires stability. Stability had to be built before any diagnostic work could begin.
KEY DECISIONS
Parallelized checkout workflow
Split checkout into 3 parallel stations: billing, price lookup, and packing — transactions continued while staff resolved unknowns
Redefined floor labor allocation
Staff reassigned to cover failure points. No additional headcount. Coverage redesigned, not expanded.
Formalized transparency protocol
Deployed a cashier transparency script ("We just opened — bear with us") that consistently converted checkout delays into expressed customer goodwill
Store closed to public at 6pm — 2hrs early
Store closed early at 6pm. Entire staff divided by aisle to manually correct barcodes and verify prices item by item. No systematic process — pure human recovery.
OUTCOME
→ Floor remained operational. Revenue continued. Investigation became possible.
// Stabilization created time.
// Time enabled precision.
// Partial — corrected ~30% of flagged items. System still incomplete.
Insight
The failure pattern was systemic across all registers, indicating a shared database issue rather than isolated terminal errors.
03
THE FIRST 10 HOURS · INCIDENT TIMELINE
From first transaction to systemic failure recognition.
0h
Store opens
Products on shelves. POS live.
No pre-registration.
1h
First "Item Not Found"
Cashier flags
Manager called to assist.
3h
Manual overrides begin
Staff hand-entering prices.
3 people per register.
6h
Cart abandonment
Customers frustrated.
Trust begins eroding.
10h
Pattern recognized
Not isolated errors.
Systemic failure.
LIVE METRICS · HOURS 1–10
~40%
Unrecognized SKUs
3
Staff per register
2–5 min
Checkout delay
"Misc"
Revenue logging
04
CRISIS SEQUENCING — CONTAIN · MAP · FIX
Sequenced by operational logic. Each phase was the precondition for the next.
The sequencing was not improvised. Containment without diagnosis is incomplete. Diagnosis without containment is impossible.
IMMEDIATE STABILIZATION
→
Hours 0–10
ROOT CAUSE MAPPING
Hours 10–36
→
STRUCTURAL INFRASTRUCTURE
Hours 36–72
02
MAP ROOT CAUSE
Locate the structural source. Eliminate incorrect paths. Confirm with precision before building.
Hours 10–36
SEQUENCING LOGIC
Diagnosis required a stable floor. Once stability was confirmed, investigation began with discipline — not urgency. The goal was a precise root cause, not a fast hypothesis.
KEY DECISIONS
Systematic floor audit
Every barcode, every aisle, documented manually. No assumptions. A failure map generated from direct observation.
Vendor invoice cross-reference
Invoice barcodes compared against POS database entries. Pattern confirmed: EAN-13 format consistently failed. Scope: ~40% of inventory.
Hardware translation tested and invalidated
Scanner-level format conversion attempted. Firmware did not support it at this hardware tier. Path documented and closed.
Root cause confirmed at database layer
POS lookup stripped the leading zero before querying. The failure was not at the terminal — it was in the shared database logic.
OUTCOME
→ Root cause confirmed. Hardware path eliminated. Fix designed for the correct layer.
// Confirmed Root Cause: Barcode format normalization error at the shared POS database layer.
One barcode format error propagated
to every terminal simultaneously.
The shared database architecture meant a single data error affected all four registers at once — making this a systemic infrastructure failure, not a terminal-level bug. Patching any individual surface would have failed.
Architecture Layer: Database · Not Terminal
Vendor Barcode
→
EAN-13 → UPC-A Strip
→
POS Database · 4 Terminals
↓
REG 01
Grocery Frt
↓
REG 02
Grocery Bk
↓
REG 03
Restaurant
↓
REG 04
Deli
1 Format Error → 4 Simultaneous Terminal Failures · 25,000 sq ft Impact
05
STRUCTURAL INTERVENTION — THE MISSING STAGE
One structural insertion. Four failure categories resolved.
03
INSERT STRUCTURAL FIX
Permanent structural correction. Operates without designer presence. Requires no ongoing maintenance.
Hours 36–72
SEQUENCING LOGIC
The fix was not designed until the root cause was confirmed. A patch would have required ongoing management. The intervention had to outlast the engagement.
KEY DECISIONS
Product onboarding stage inserted
A mandatory step between delivery and shelving. Checkout moved from first system encounter to final verification. No product reaches the floor without registration.
Barcode normalization tool built and deployed
Invoice barcodes compared against POS database entries. Pattern confirmed: EAN-13 format consistently failed. Scope: ~40% of inventory.
Role ownership defined at every stage
Receiving, Cashier, Stock, and Restaurant separated. Each stage had an owner. Improvisation made structurally unnecessary.
Receiving checklist documented
A 5-step checklist formalized the onboarding stage. Non-technical. No training session required. Staff adopted it independently.
OUTCOME
→ Structural insertion. System held without designer present.
// The intervention was designed to function without ongoing designer involvement.
The intervention was not four separate fixes. Inserting a mandatory product onboarding stage between delivery and shelving resolved the operational, financial, trust, and organizational failure categories simultaneously. The right insertion point changes everything downstream.
Before
Delivery
→
——— MISSING STAGE ———
→
Stock Shelf
→
Checkout ✗
After — Structural Insertion
Delivery
→
Product Onboarding ✓
→
Stock Shelf
→
Checkout ✓
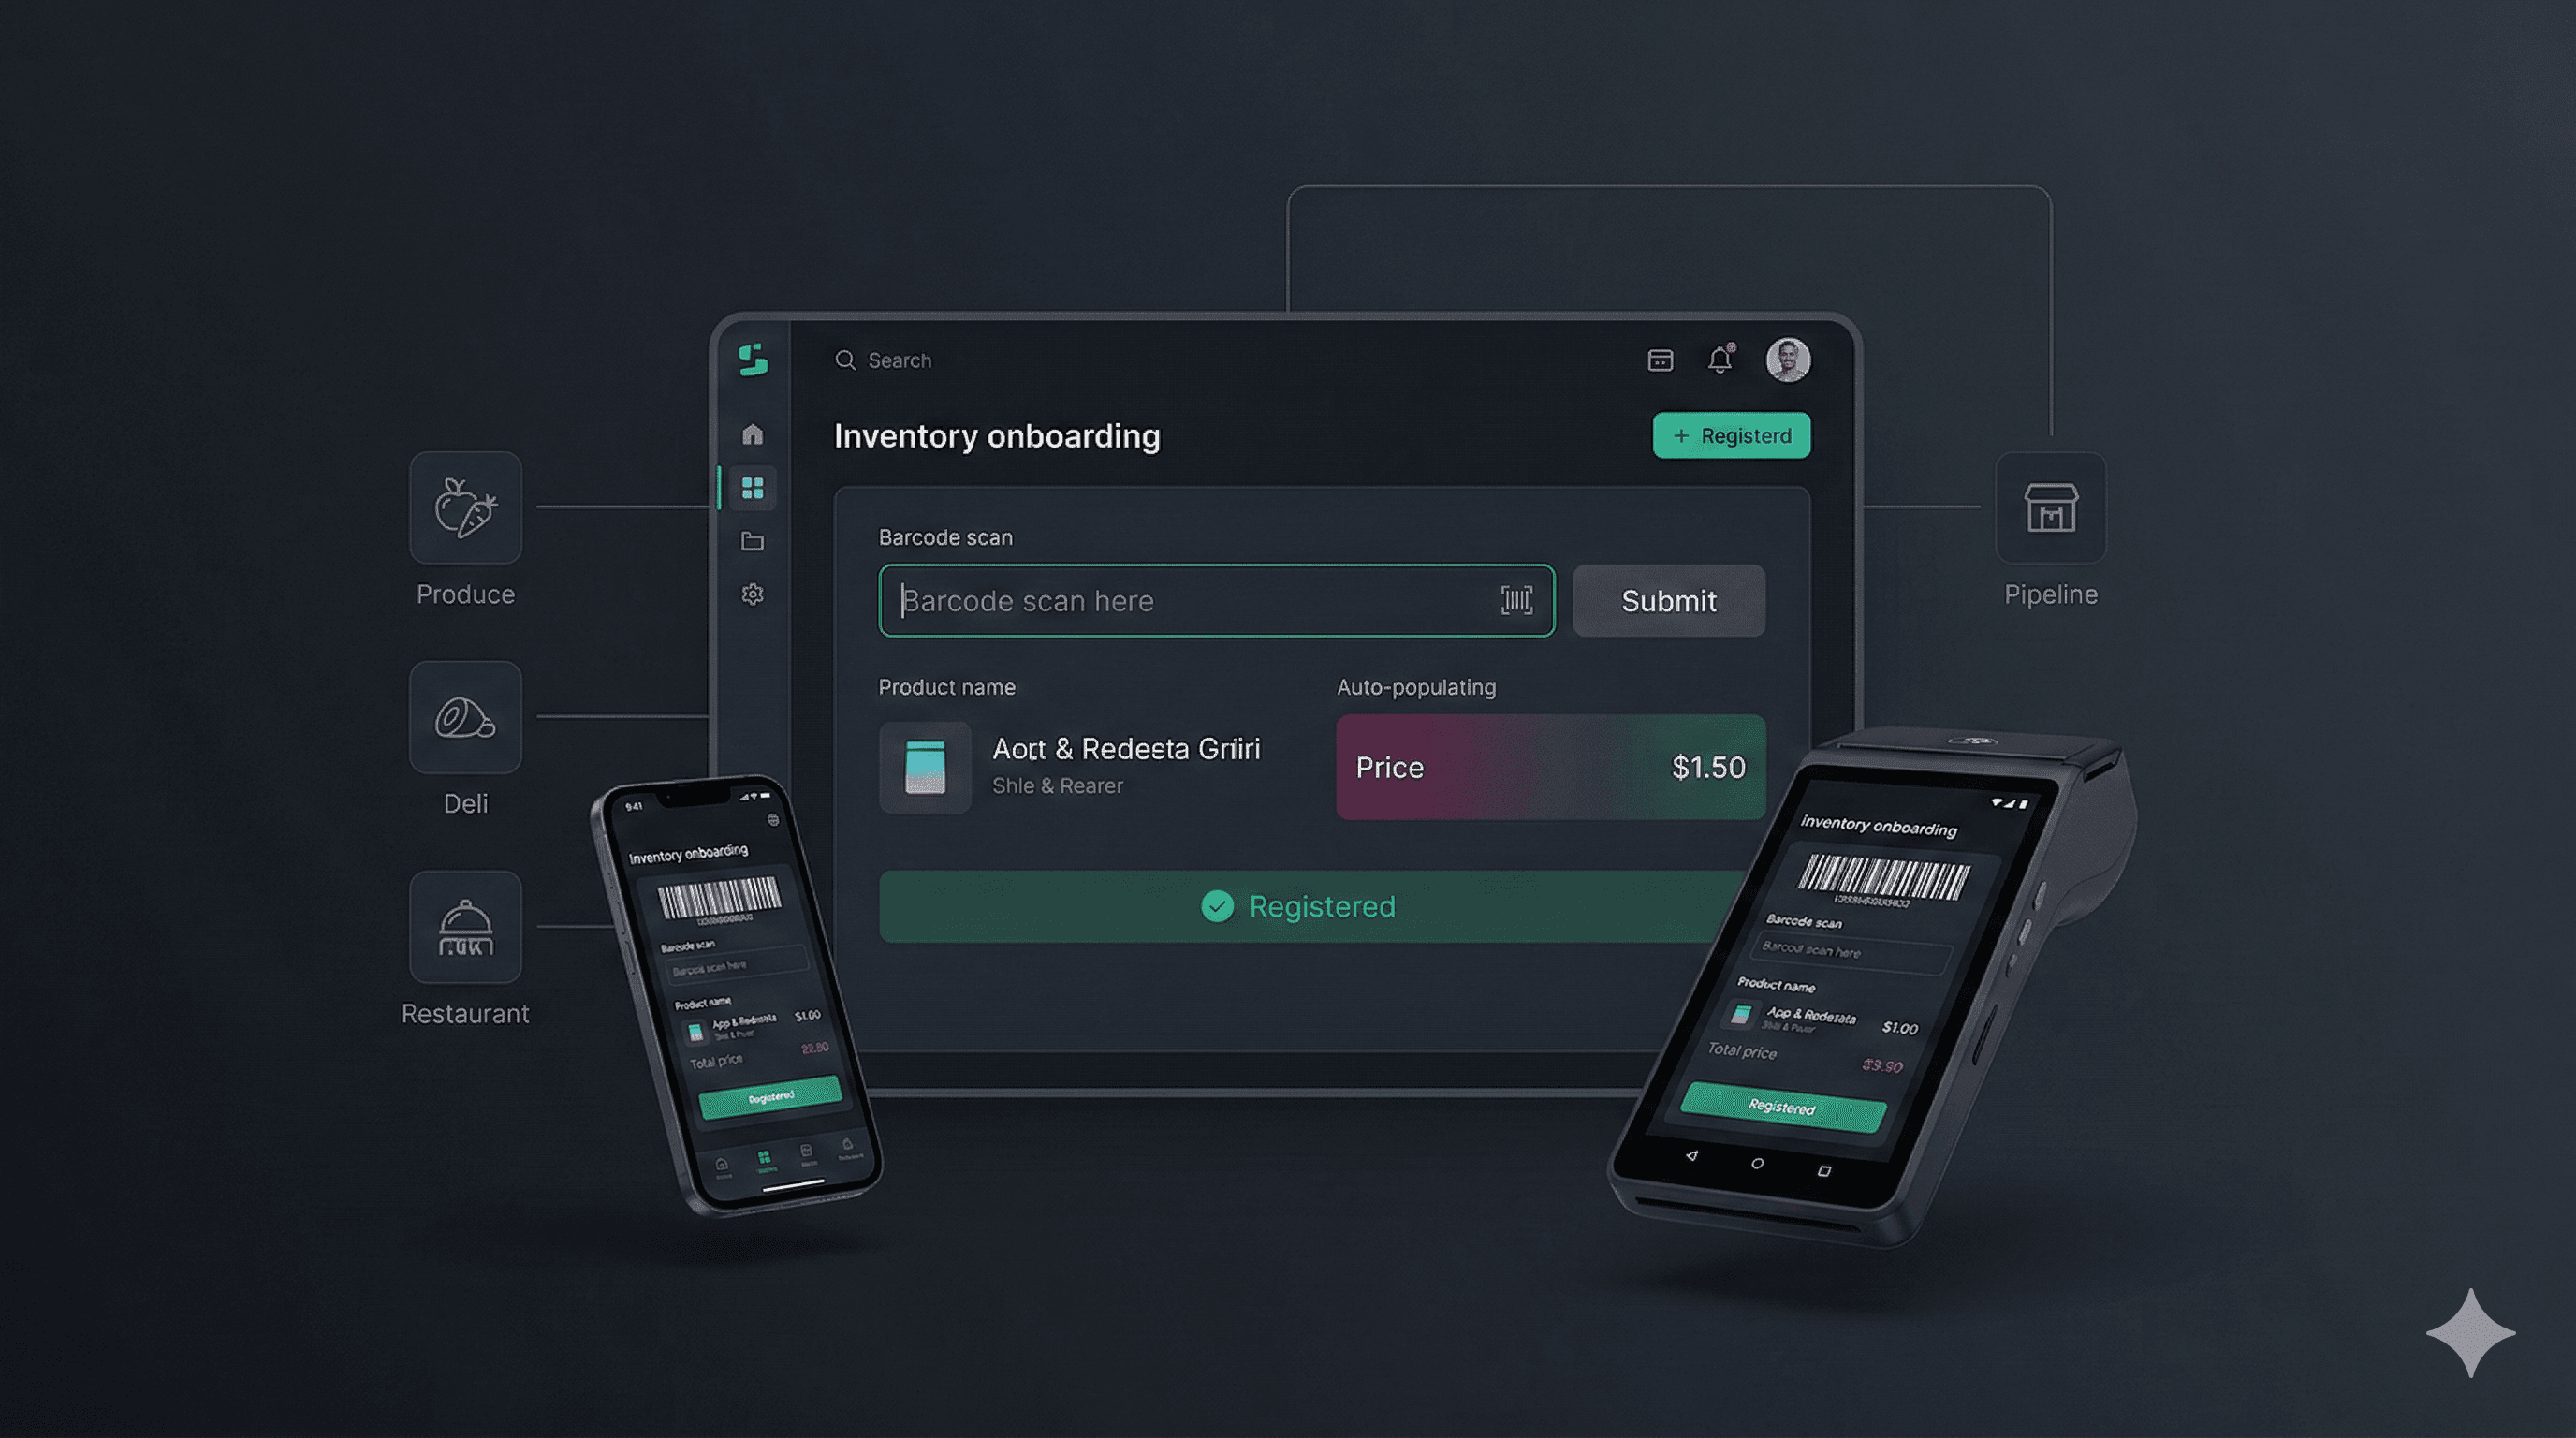
THE INSERTED STAGE — PRODUCT ONBOARDING
MANDATORY BEFORE SHELVING · 5-STEP SEQUENCE
01
Scan barcode
Any barcode format accepted at input stage.
02
Normalize
EAN-13 → UPC-A conversion. Leading zero restored.
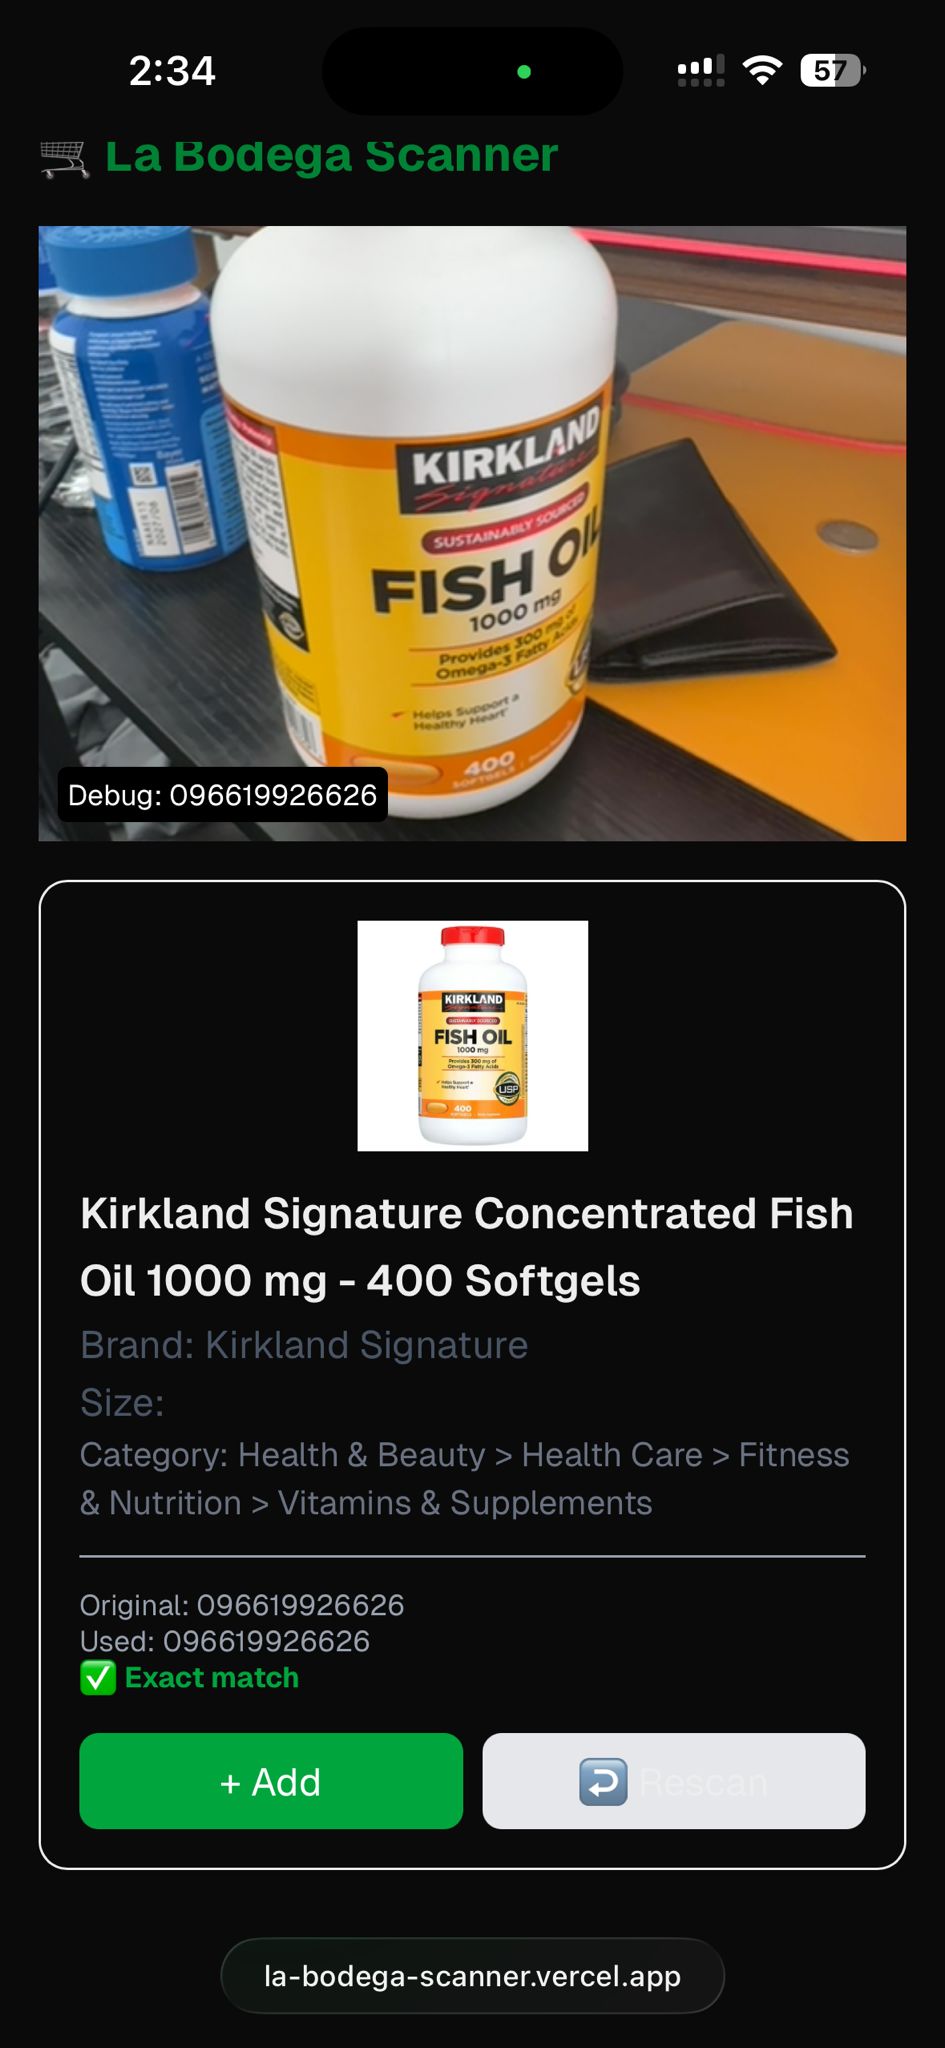
03
API lookup
UPC database returns product name, category, description.
04
Price
Competitor-benchmarked price calculated per unit against normalized cost. Registered before shelving.
05
Export & import
Batch CSV exported. Imported to POS. Product registered.
FAILURE CATEGORIES RESOLVED SIMULTANEOUSLY
OPERATIONAL
Checkout no longer the first system encounter. Products pre-registered before shelving.
REVENUE
"Misc" billing eliminated. Every transaction attributed to a specific product.
TRUST
Price integrity established before shelving. No shelf-to-POS mismatch.
ORGANIZATIONAL
Receiving role defined. Clear ownership. Improvisation made unnecessary.
Reflection
This changed the first system encounter from checkout to receiving, preventing unregistered inventory from reaching the sales floor.
06
PRODUCT & TOOL DESIGN
Built to solve the problem today.
Not next sprint.
The solution had to work within the existing POS infrastructure — not replace it. That constraint defined the approach: build a normalization layer that operates upstream, feeding correct data into the system the store was already committed to using.
DECISION — WHY BUILD VS. ALTERNATIVES
OPTION
VERDICT
REASON
Replace POS system
REJECTED
Required 2–3 week procurement and configuration. Outside the 72-hour window. Mandate explicitly prohibited it.
Manual entry per product
REJECTED
Viable at ~40 SKUs. Fails at 2,500+. Not a structural solution. Would require ongoing manual maintenance.
Hardware scanner translation
TESTED & INVALIDATED
Firmware at this hardware tier does not support format conversion. Path eliminated after testing. Documented.
External normalization tool
SELECTED
Operates outside the POS. No engineering dependencies. Deliverable within 24 hours. Deployable by non-technical staff.
ARCHITECTURE · BARCODE NORMALIZATION PIPELINE
SCAN
Barcode input
NORMALIZE
Barcode input
LOOKUP
UPC API
BENCHMARK
Competitor price
EXPORT
Batch CSV
POS IMPORT
DB Updated
DEPLOYMENT SPECIFICATIONS
24h
Design to live deployment
Built and deployed within the first 48h of engagement.
Mobile
Deployment platform
Staff used existing devices. No hardware procurement.
0
Engineering dependencies
No backend. No install. No API keys. Browser-based mobile web.
Active
Status post-engagement
Still in use. Not replaced. Staff-trained-staff on Day 3.

KEY DESIGN DECISIONS
UPC API auto-population
Product name and description returned on scan.
Zero manual entry for product information.
Competitor price benchmarking
Market price sourced per product. Competitive price set individually
No fixed formula applied across categories.
Batch CSV export
Formatted for direct POS import. No staff reformatting. One action: export → import.
No install, no login
Mobile web. Staff used existing phones.
No accounts, no credentials, no onboarding friction.
Reflection
The tool was implemented as a browser-based mobile interface used by receiving staff during product onboarding.
07
BUSINESS MODEL CORRECTION
Pricing decisions were being made without normalized unit cost or market reference. It's a guess.
A fixed markup percentage was never feasible — margin varies by product, vendor, and category. The approach: normalize the unit cost, source the competitor price for that exact product, then set a price that is competitive in market and viable for the business. Every product priced individually. No formula applied uniformly.
PRICING ERROR CHAIN — FROM DATA ENTRY TO WRONG PRICE
VENDOR
CASE UNIT
Invoice price
WRONG
ENTRY
Unit size mismatch
INFLATED
UNIT COST
Cost basis wrong
NO MARKET
BENCHMARK
Price unvalidated
WRONG
PRICE SET
Over/Underpriced
Two compounding errors: wrong cost basis (pack size not normalized) and no market benchmark to catch it. A price could appear internally valid while being above market (losing customers) or below cost (losing margin) — neither detectable without a corrected unit cost and a competitor reference.
WHAT TRIGGERED LEADERSHIP URGENCY
First-day margin bleed
Revenue was recorded but unattributable. Unit costs were pulled from case invoice totals, not normalized per-item. Leadership reviewed end-of-day data and could not confirm a single product's margin.
Dispute exposure identified
Price disputes at the register had no resolution path. Financial traceability risk elevated as active liability, not a future concern.
REACTIVE STABILIZATION → STRUCTURAL CORRECTION
Temporary price matching
While unit costs were being normalized, contested shelf prices were matched to visible competitor market rates on disputed items. Trust stabilization — not a structural fix.
Structural replacement
Once the normalization pipeline was operational, competitive benchmarking replaced reactive discounting. Every price set upstream — before shelving — against correct cost basis and verified market reference.
PRICING MODEL INSERTED — COMPETITIVE MARKET BENCHMARK
01
NORMALIZE UNIT COST
Vendor invoice cost ÷ actual pack size. Cost basis corrected at receiving.
02
SOURCE COMPETITOR PRICE
For the same UPC or equivalent product — nearby stores, online listings. Actual market rate.
03
EVALUATE VIABILITY
Competitor price vs. unit cost. If market rate is viable, match or price slightly below.
04
SET COMPETITIVE PRICE
Price registered at onboarding. No fixed formula. Margin varies by product — and is now verifiable.
CORRECTION APPLIED — BY PRODUCT CATEGORY
GROCERY
Market-comparative
BEFORE
Pack size not normalized → inflated unit cost → price set without market validation → over or underpriced vs. competitors.
AFTER
Unit cost normalized per item. Competitor shelf price sourced for the same UPC. Competitive price applied — market-validated, financially viable.
RESTAURANT
Market-comparative
BEFORE
Menu items registered without ingredient cost breakdown. Prices set by intuition — no competitor comparison, no verifiable margin.
AFTER
Ingredient costs mapped per dish. Competitor menu prices benchmarked for equivalent items. Price set at competitive market level per dish.
PRODUCE
Market-comparative
BEFORE
Handwritten price labels. No weight-tier logic. Inconsistent pricing across staff shifts. No competitor reference.
AFTER
Price per lb benchmarked against nearby market rates for equivalent grade. Consistent, competitive price applied at receiving.
PRICING METHOD
Fixed % on wrong base
→
Market-comparative per product
Each product priced against actual competitor data. Not a formula.
REVENUE DATA
"Miscellaneous" category
→
Product-level records
Attribution corrected at onboarding. Not at checkout.
MARGIN VISIBILITY
Unverifiable
→
Verifiable per product
Variable by product. Now traceable. Improvable over time.
Impact
Price disputes at checkout dropped significantly once shelf pricing was validated during onboarding.
08
ORGANIZATIONAL & BEHAVIORAL CHANGE
Fixing the system was necessary. Changing how the organization operated it was the work.
Four layers of change ran simultaneously: authority and alignment, executive mental model shift, governance introduction, and frontline behavioral design. Each required a distinct approach.
A
AUTHORITY, ALIGNMENT & DECISION BOUNDARIES
REPORTING STRUCTURE
Reported directly to CEO during launch week
Daily 4 PM review — CEO, store manager, co-investor
Sole product and service designer.
FULL AUTHORITY
Operational restructuring and role definition
Workflow and tool design and deployment
Staff behavioral protocols and receiving architecture
CONSTRAINED — REQUIRED ALIGNMENT
POS infrastructure: mandate-prohibited, 2–3 week lead
Pricing decisions: investor sign-off required
Bulk POS imports: investor alignment before execution
INITIAL LEADERSHIP ATTRIBUTION
CAUSE
"A spreadsheet error." Manual correction proposed.
SCALE MODEL
Factory mindset: ~40 SKUs managed by owner memory. Applied to 2,500+ SKU operation.
RISK CLASS
Operational inconvenience.
PROPOSED FIX
Manual reconciliation per product. No structural change.
REFRAMED DIAGNOSIS
CAUSE
Barcode format mismatch at database layer. 40% of inventory affected. Scale-incompatible process model.
SCALE MODEL
Supermarket reality: 2,500+ SKUs, multi-vendor, turnover. Memory is not a system.
RISK CLASS
Financial traceability exposure. Customer dispute liability. Revenue data structurally corrupt.
PROPOSED FIX
Structural correction upstream. Not patchable at the terminal or by manual entry.
FINANCIAL RISK — ACTIVE EXPOSURE
The store processed roughly $3K–$5K in daily transactions and up to $8K–$10K on weekends.
With ~40% of SKUs unrecognized at checkout, a large portion of transactions were recorded without product attribution.
DEMONSTRATION STRATEGY — HOW ALIGNMENT WAS BUILT
GPT invoice extraction workflow
Built in parallel. Automated vendor invoice parsing to normalize product data at scale.
Manual vs. automated volume comparison
Within 24 hours: manual processing rate demonstrated against automated throughput. Volume made the case.
Hybrid safeguard proposed
Automation for scale. Manual validation before POS import. Condition: vendor unit cost < shelf price ≤ market ceiling.
SPEED
Created alignment. The automation case was made with demonstrated output, not projected estimates.
VERIFICATION
Preserved executive confidence. The manual validation gate before import maintained investor control.
LIVE FLOOR PERSUASION
Spanish produce naming was initially resisted by store management. Rather than arguing the case, checkout latency was demonstrated directly on the floor. Staff and the manager observed a customer delay caused by English-only catalog terms returning no match. Behavioral friction was the evidence. Naming was corrected the same hour. Lookup failure eliminated.
B
FROM MANUAL CONTROL TO SCALABLE ARCHITECTURE
CURRENT MINDSET — FACTORY SCALE
~40 SKUs, managed by owner memory.
Manual tracking worked at this scale.
One person held the full inventory model.
"We've always done it this way."
OPERATIONAL REALITY — SUPERMARKET SCALE
2,500+ active SKUs. Vendor-diverse. Constant turnover.
Memory fails at this scale. Process is required.
Multiple staff, categories, and vendor formats.
Replicable. Trackable. Scalable without redesign.
C
GOVERNANCE & REPORTING CORRECTION
BEFORE — FRAGMENTED
Staff escalated to whichever investor was reachable.
Different investors received different operational versions.
No standardized reporting format or cadence.
Decisions informal, undocumented, inconsistent.
AFTER — CENTRALIZED
Weekly review meeting — one agenda, both investors.
Single communication channel for operational issues.
Decision log maintained and accessible.
Personality-driven decisions replaced by system-driven cadence.
The weekly review was not a coordination tool. It was a governance artifact. Decision-making moved from reactive and verbal to structured, documented, and investor-unified.
D
FRONTLINE BEHAVIORAL DESIGN & RETENTION ARCHITECTURE
IMPROVISATION → STRUCTURED OWNERSHIP
Checkout error response
BEFORE
Silent. Manager called. Customer waited.
AFTER
Transparency script: context delivered. Complaints dropped.
Produce lookup
BEFORE
English catalog terms. Frequent lookup failure.
AFTER
Spanish first. English in parentheses. Lookup time eliminated.
Language adaptation
BEFORE
Script in English only.
AFTER
Staff adapted script to Spanish independently. Not instructed.
Cart abandonment
BEFORE
Frequent. Price mismatch at terminal.
AFTER
Near-eliminated. Mismatches resolved at source (onboarding).
RETENTION ARCHITECTURE
01
OPERATIONAL STABILITY
Checkout became reliable. Price integrity restored. Trust baseline rebuilt.
02
LOYALTY ENROLLMENT
"Would you like 2% back on every purchase?" Deployed end-of-transaction. No friction added.
03
RETENTION CHANNEL CREATED
Contact capture + repeat visit incentive. Transactional relationship → relational. Structural, not promotional.
Operational and relational recovery advanced simultaneously. Two streams. One 72-hour window.
Trade-offs and Constraints
Trade-offs and Constraints
• POS vendor dependency remained unchanged
• CSV import still required manual execution
• No real-time pricing dashboard implemented
• Scalability beyond a single location not yet validated
08
ORGANIZATIONAL & BEHAVIORAL CHANGE
Reflection
This project reinforced the importance of diagnosing structural causes before implementing surface-level fixes.
Three lessons shaped the intervention
Operational systems fail when scale assumptions change.
Upstream process design is often more effective than interface redesign.
Stabilization and diagnosis must occur in sequence during live failures.